If I can’t tie a placement to recall, clicks, sales, and ROI, I can’t call it a win. That’s the whole point of this checklist.
Here’s the short version: I need to set one KPI per goal, log how the product appears, track whether people stayed long enough to see it, measure recall and sentiment, then connect traffic and orders back to the placement. Without that setup, view counts can look good while business impact stays unclear.
I’d use this checklist to track:
- Goals and KPIs before launch
- Baselines from at least 30 days before release
- Exposure like screen time, frame share, and watch-through to first appearance
- Recall and awareness lift with exposed vs. control surveys
- Engagement and sentiment across clicks, comments, and mention volume
- Purchase intent, conversions, sales lift, and ROI
- Post-campaign learnings to improve the next placement
A few numbers from the article stand out:
- Recall often drops after about 14 days
- Average cumulative exposure in one field study was 5.43 seconds
- Add-to-cart rates from placement traffic often land around 8%–12%
- A $5,000 integration that drives $12,000 in incremental revenue at a 50% margin yields 20% ROI
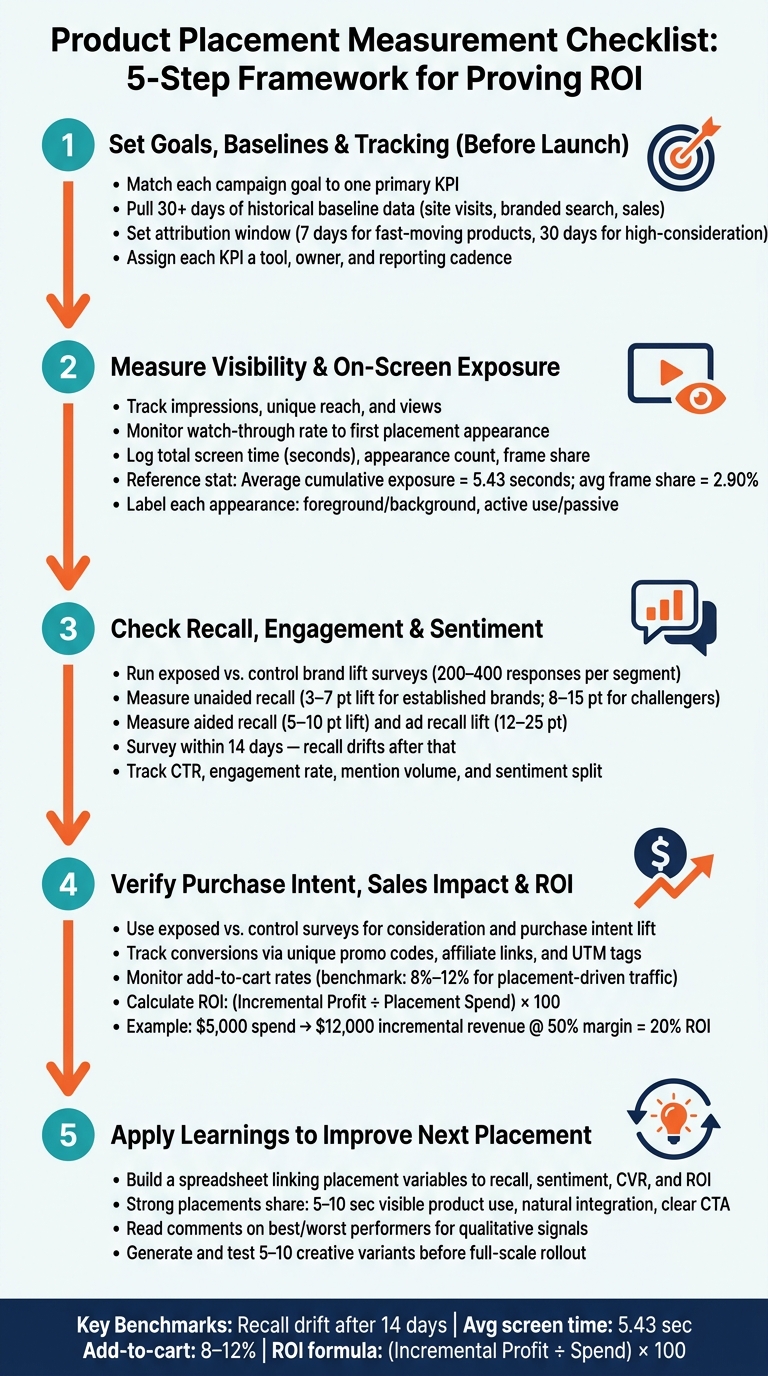
Product Placement Measurement Checklist: 5-Step Framework for Proving ROI
Ask BENlabs | Measuring Product Placement ROI
sbb-itb-0df1f49
Quick Comparison
| Stage | What I check | Main output |
|---|---|---|
| Before launch | Goal, KPI, baseline, attribution window, tracking links | Clean measurement setup |
| During delivery | Reach, watch time, first appearance, screen time, prominence | Proof the placement was seen |
| After exposure | Recall, engagement, CTR, sentiment | Proof people noticed and reacted |
| Business impact | Intent, conversions, revenue, ROI | Proof it drove results |
| Next round | Pattern review and test changes | Better future placements |
In other words: product placement success is not just about being on screen. It’s about being seen, being remembered, and driving action.
Checklist Part 1: Set Goals, Baselines, and Tracking Before Launch
Measurement starts before launch. That’s the part many teams miss.
Your setup determines whether you can show ROI later. If the setup is weak, you may get views, clicks, or sales, but you won’t be able to connect them back to the placement with much confidence. And if you can’t connect exposure to lift, the reporting gets shaky fast.
Match each campaign goal to a KPI
Before launch, tie each campaign goal to one primary KPI.
| Campaign Goal | Primary KPI | Example Success Threshold |
|---|---|---|
| Brand awareness | Reach + brand awareness lift | Set a numeric lift target before launch |
| Recall | Aided and unaided recall scores | Aim for a measurable lift, such as 10 percentage points in aided recall |
| Engagement | CTR + post interaction rate | Set a minimum interaction benchmark |
| Purchase intent | Survey lift in consideration or intent | Target a measurable lift in intent |
| Sales impact | Conversions + cost per conversion | Keep cost per conversion under a set threshold, such as $25 |
Set the threshold before the campaign runs. That’s what separates useful measurement from after-the-fact justification.
Nielsen reported that each one-point increase in awareness and consideration drives a 1% increase in future sales, which gives you a direct way to connect awareness goals to revenue expectations.
Once the goal is mapped, the next job is to measure visibility and exposure.
Document placement details that affect performance
Two placements can have the same budget and still perform very differently. Why? Because how the product appears on screen matters a lot.
Record the content type – such as a YouTube video, influencer post, branded entertainment piece, or short-form social clip. Track on-screen duration in seconds, logo size and visibility, whether the placement sits in the foreground or background, and whether the talent used or mentioned the product on screen. Also note whether the placement felt built into the scene or dropped in awkwardly.
You should also log audience and distribution context: U.S. geography, device mix, and demographic profile. The same placement can land one way with one audience and a very different way with another, even when the creative stays the same. Writing this down makes later analysis much easier. Otherwise, you’re left guessing why one campaign worked and another didn’t.
Confirm baselines, attribution windows, and tools
Pull at least 30 days of historical data before the placement goes live. That should include site visits, branded search activity, and sales. Also document current sentiment and brand share of voice.
Without those baselines, you can only report raw totals after the campaign. And raw totals don’t tell you much. Lift is the number that matters.
Pick your attribution window based on the usual purchase cycle for the product. A shorter window, like 7 days, may fit faster-moving products. Higher-consideration products may need a longer window, such as 30 days. Use the same attribution window across placements so your comparisons stay clean.
Before launch, assign each KPI a tool, an owner, and a reporting cadence. Every KPI needs a named method. That way, each placement gets measured on the same terms.
With baselines and tracking in place, the next step is measuring what viewers actually saw on screen.
Checklist Part 2: Measure Visibility and On-Screen Exposure
Next, check whether the placement was actually seen. Big view counts can look great on paper, but they don’t mean much if most people never made it to the moment where the product showed up.
Impressions tell you how many times the content was served. Unique reach tells you how many people saw it at least once. Views tell you how many times someone watched past the platform’s threshold. But those numbers only go so far. What matters is whether viewers stayed long enough to reach the placement.
That’s why average watch time and placement watch-through rate to the first appearance timestamp matter so much. Say a product shows up at the 7-minute mark in a 10-minute YouTube video, but most viewers drop off by minute 5. On paper, the video may have plenty of views. In practice, the placement got far less exposure than the count suggests. Flag any placement that appears after a sharp retention drop.
You should also track frequency, or how many times one person was exposed to the content. Seeing something more than once can help people remember it, but only up to a point. After that, the effect tends to level off. Once you know who had a chance to see the placement, the next step is figuring out what they saw.
For each placement, log:
- Appearance count
- Total screen time in seconds
- Average duration per appearance
A field study found that cumulative exposure ranged from 0.34 to 40.28 seconds, with a 5.43-second mean and 2.90% average frame share. That’s a useful reality check. It shows how easy it is to assume viewers noticed more than they actually did.
Prominence matters just as much as duration. A product held up to the camera, with the logo easy to see, taking up about 20% of the frame while a creator talks about it for 10 seconds is not the same as that product sitting on a shelf in the background at 2% of the frame. Longer cumulative exposure, central screen position, and larger frame share are all tied to stronger recall.
Label each appearance as foreground or background and active use or passive placement. Active use usually performs better. If the creator holds, wears, or demonstrates the product, people are more likely to notice it than if the logo just sits quietly in the shot.
Use AI video analytics and a placement comparison table
Manual frame-by-frame review is fine for one or two videos. It falls apart fast once the volume grows. AI video analytics can scan each frame, detect logos or product shapes, measure screen time, estimate frame share, and sort appearances into foreground or background.
When you pair that with platform retention data, you get a much better read on performance. You’re not just seeing whether the product appeared. You’re seeing whether people were still watching when it appeared. That’s a big difference.
PyxelJam’s AI video production and analytics capabilities can support this process from pre-production planning through post-campaign analysis, including side-by-side comparisons of total viewed screen time, prominence score, and watch-through rate to the first placement.
Use a comparison table to review placements next to each other:
| Placement | Content Asset | Platform | First Appearance | Total Screen Time | Prominence | Views | Watch-Through Rate to Placement |
|---|---|---|---|---|---|---|---|
| P1 | Creator Vlog – Tech Setup Tour | YouTube | 0:18 | 34 sec | High – foreground, active use | 420,000 | 71% |
| P2 | Lifestyle Haul Video | Instagram Reels | 0:05 | 12 sec | Medium – foreground, passive | 185,000 | 83% |
| P3 | Gaming Stream Highlight | YouTube | 6:45 | 8 sec | Low – background, passive | 310,000 | 38% |
| P4 | Branded Entertainment Segment | YouTube | 1:10 | 52 sec | High – foreground, active use | 275,000 | 67% |
P3 brought in views, but visibility was weak and prominence was low. P4 had fewer views, yet it delivered more than six times the screen time, with strong prominence and a solid watch-through rate. If view counts looked strong but exposure was weak, the next thing to check is recall and engagement.
Checklist Part 3: Check Recall, Engagement, and Sentiment
Strong visibility numbers from Part 2 show the product appeared on screen. This part gets at something different: did people notice it, remember it, and feel good about it?
Run brand recall and awareness checks
Keep unaided recall, aided recall, and placement recall separate. They measure different things: unaided recall tests brand memory without prompts, aided recall tests recognition after a prompt, and placement recall checks whether viewers remember the integration itself.
Use a control-vs.-exposed setup. One group saw the placement, a matched group did not, and both groups answer the same survey questions. The gap between those groups is your incremental lift.
Typical campaigns produce:
- 3–7 points of unaided lift for established brands
- 8–15 points for challenger brands
- 5–10 points of aided lift
- 12–25 points of ad recall lift
For survey size, aim for at least 200–400 responses per key segment. And don’t lean only on point estimates. Report confidence intervals too.
Timing matters here. Recall can start to drift after about 14 days, so run brand lift surveys during the campaign or soon after it ends. Then compare the results with the goal you set before launch – for example, +10 points in ad recall among 18–34 YouTube viewers – instead of treating any upward movement as a win.
If memory lifts, the next step is simple: see whether that attention turned into clicks and watch-time.
Measure clicks and content engagement around the placement
Compare CTR, engagement rate, average view duration, and completion rate on sponsored content against the same creator’s non-sponsored posts or nearby episodes. That comparison gives you a cleaner read on whether the integration changed audience behavior.
Audiovisual placements, where people both see and hear the brand, tend to stick more and drive more action than seen-only or heard-only formats.
If clicks go up, don’t stop there. Make sure the response was positive, not just noisy.
Monitor sentiment with listening tools and a performance table
High recall and high clicks can still be a problem if sentiment turns negative. Set up your social listening tool to track the campaign hashtag, the creator’s handle, the video title, and direct brand mentions across social platforms and forums. Use a two-week pre-launch baseline.
Watch mention volume, sentiment split – positive, neutral, negative – and share of voice. If mention volume is high but most reactions are negative, the placement got attention for the wrong reason. On the other hand, moderate volume with strong positive sentiment and rising share of voice is often a better sign for long-term brand equity.
Also read the comments. That’s usually where the pattern shows up first. Look for repeated themes like a natural integration, a useful product demo, or a placement that felt too forced.
Use one table to compare recall, engagement, CTR, sentiment, and themes across placements.
| Placement | Recall | Engagement | CTR | Lift vs. Baseline | Sentiment | Notable Themes |
|---|---|---|---|---|---|---|
| Placement A – YouTube vlog | High unaided and aided recall | Above baseline | Strong | Positive lift across all metrics | Mostly positive | Natural integration; viewers asking where to buy |
| Placement B – Another creator video | Lower recall | Near baseline | Modest | Minimal lift | Mixed or polarized | Lower recall; mixed feedback |
If you want a concrete benchmark, one YouTube vlog example delivered 28% unaided recall, 65% aided recall, 18% CTR on the product link, an engagement rate 1.4x the channel average, and a sentiment split of 62% positive / 28% neutral / 10% negative.
Placements with clear visual branding and creator endorsements tend to produce higher unaided recall and more positive sentiment. Heavy-handed or off-fit integrations often pull in more negative comments, even when CTR looks decent at first glance.
If recall, engagement, and sentiment all look strong, the next thing to check is whether the placement changed purchase intent and sales.
Checklist Part 4: Verify Purchase Intent, Sales Impact, and ROI
Strong recall and positive sentiment are good signs. But on their own, they don’t bring in revenue. This part connects what people say and feel about the brand to what they actually do.
Measure lift in consideration and purchase intent
Use the same exposed-vs.-control survey setup from earlier sections, along with a neutral content prompt, to measure lift.
For each metric, stick with the same 5- or 7-point Likert scale and ask one question per metric:
- Consideration: "How likely are you to consider [Brand] the next time you purchase [category]?"
- Favorability: "Overall, how favorable is your impression of [Brand]?"
- Purchase intent: "How likely are you to purchase [Brand] in the next 30/60/90 days?"
Then compare exposed vs. control, and measure post-campaign lift against the pre-campaign baseline. Say exposed purchase intent comes in at 42% and control is 30%. That gives you a +12 percentage point lift.
Treat this as a leading signal, not final proof. People often say they’re more likely to buy than they are to actually follow through, so check these survey results against conversion data.
Track conversions with coupon codes, affiliate links, and UTM tags
If intent goes up, the next step is tying that lift to traffic and orders you can trace back to the placement.
Give each creator or episode a unique promo code such as CREATORNAME10. That lets you link redemptions to a specific placement.
For affiliate placements, create a separate tracking link for each creator inside your affiliate platform. Add UTM-tagged URLs using one naming pattern: utm_source=youtube, utm_medium=product_placement, utm_campaign=summer_launch_2026, utm_content=creatorname_video1. Then route each tagged link to a dedicated landing page that fits the content people just saw.
Once visitors land on the site, don’t stop at clicks. In GA4, watch time on site, pages per session, add-to-cart rate, and checkout completion rate. In U.S. e-commerce, placement-driven traffic often has bounce rates below 40%, time on page of about 1:30 to 2:00 minutes, and add-to-cart rates of 8% to 12%. If that traffic leaves fast and conversion is weak, the message in the content likely doesn’t line up with the landing page.
Calculate sales lift and ROI with a results table
Use conversion data to estimate how much revenue the placement likely drove.
Match your baseline period to the campaign in both length and seasonality. Then compare baseline weekly revenue with campaign-period weekly revenue. If your baseline was $50,000 per week and the campaign period averaged $65,000 per week, incremental revenue is $15,000. From there, subtract the expected effect of other activity running at the same time, like email, paid search, or promotions, so you can isolate what the placement likely produced.
A region or audience holdout can help here. Expose one set of markets to the placement and keep a similar set unexposed. Then compare per-capita sales. If exposed regions grow by 18% and control regions grow by 5%, the attributable lift is about 13 percentage points.
Use this formula for ROI: ROI = (Incremental Profit ÷ Placement Spend) × 100. Incremental profit equals incremental revenue multiplied by gross margin, minus placement spend. At a 50% margin, a $5,000 YouTube integration that drives $12,000 in incremental revenue produces $1,000 in incremental profit and a 20% ROI.
Use the table below to compare placements side by side. AOV helps show revenue efficiency for each placement.
| Placement | Spend (USD) | Sessions | Conversions | AOV (USD) | Incremental Revenue (USD) | Sales Lift (%) | ROI (%) |
|---|---|---|---|---|---|---|---|
| YouTube – Creator A Ep1 | $5,000 | 3,200 | 160 | $75.00 | $9,000 | 18% | 80% |
| Podcast – Show B Ep12 | $3,500 | 1,100 | 55 | $85.00 | $4,675 | 10% | 33% |
| IG Reels – Creator C | $2,000 | 1,800 | 45 | $60.00 | $2,700 | 7% | 35% |
This side-by-side view shows which placements drove strong financial returns and which mostly delivered awareness without enough revenue impact. Keep margin assumptions and channel-level adjustments in one shared sheet.
Use these results to decide which placements are worth repeating and which ones need a different creative angle.
Checklist Part 5: Use the Data to Improve the Next Placement
Identify what drove strong and weak results
Part 4 showed which placements won. This section gets into why they won.
Build a spreadsheet that ties each placement to its main creative variables: placement type, screen time, CTA, and creator fit. Then layer in recall lift, sentiment, conversion rate, and ROI so you can spot patterns fast.
In many cases, strong placements share the same traits: 5–10 seconds of visible product use, natural integration, and a clear CTA. Weak placements tend to miss those marks.
It also helps to read comments on the best- and worst-performing videos. People will often tell you, in plain language, if the integration felt forced or if the offer was confusing. Use those patterns to shape the next creative test.
Test new creative variations with PyxelJam

Once you know which creative variables moved results, test better versions before you roll anything out at full scale. PyxelJam’s AI video production helps teams generate alternate placement cuts fast by changing scene selection, camera framing, voiceover script, product reveal timing, or feature emphasis without a full reshoot. That makes it simple to produce 5–10 test variants for a single placement.
A simple testing flow looks like this:
- Start with a clear hypothesis
- Use PyxelJam to generate variants built around that hypothesis
- Split similar audience segments across YouTube or CTV
- Track view-through rate, click-through rate, code redemptions, and cost per acquisition with UTM tags
- Compare results by audience segment and platform
- Scale the version the data shows is winning
After launch, PyxelJam voice agents can answer product questions, log recurring objections, and feed those patterns into the next video brief.
Conclusion: The Core Checklist for Proving Product Placement ROI
Use the same five checkpoints every time: define KPIs, document placement details, measure exposure, validate recall and sentiment, track sales, and apply the learnings to the next placement.
Side-by-side comparisons and clear attribution make placement measurement a repeatable process. When budget, creator, and creative choices are backed by scored placements, controlled tests, and documented learnings, each campaign ends with a brief that makes the next one sharper.
FAQs
What if I can’t track sales directly?
If you can’t tie a campaign straight to sales, look at the signals that show how your brand is doing and how people are reacting.
Use brand lift surveys to measure shifts in consumer perception and purchase intent. Watch for search spikes too, since they can point to more interest in your brand.
It also helps to track engagement metrics like likes, comments, shares, and retention rates. And use aided brand recall to gauge how well your product sticks with the audience.
How long should I measure results after a placement?
Measure results as a long-term process, not just a short campaign. Product placement can keep paying off well after the first release through streaming, syndication, and reruns.
Start tracking metrics like brand recall, search spikes, and sales lift when the content goes live. Then keep watching those numbers over time. Tools like UTM links and unique coupon codes can help show which placements are still driving measurable results.
Which metrics matter most for ROI?
Prioritize metrics that link visibility to revenue: brand recall, branded search volume, and attributed sales. When a product shows up naturally in the content people are already watching, it tends to stick. That matters because many U.S. consumers go on to search for products they notice on-screen.
To connect those results to ROI, track performance with unique discount codes, dedicated landing pages, and UTM parameters. Net Placement Value can help you compare the cost of that exposure with what you’d pay for ads, while AI-powered analytics can track engagement in real time and support A/B testing.